Compact or Diffuse
Definition: Specifies whether the egg collected is compact or diffuse
Spreadsheet Variable Name: Compact_Diffuse
Format: C or D
Required Upload or Computed After Upload: Required upload
Random Forest Predictor Variable: Yes
Additional Information:
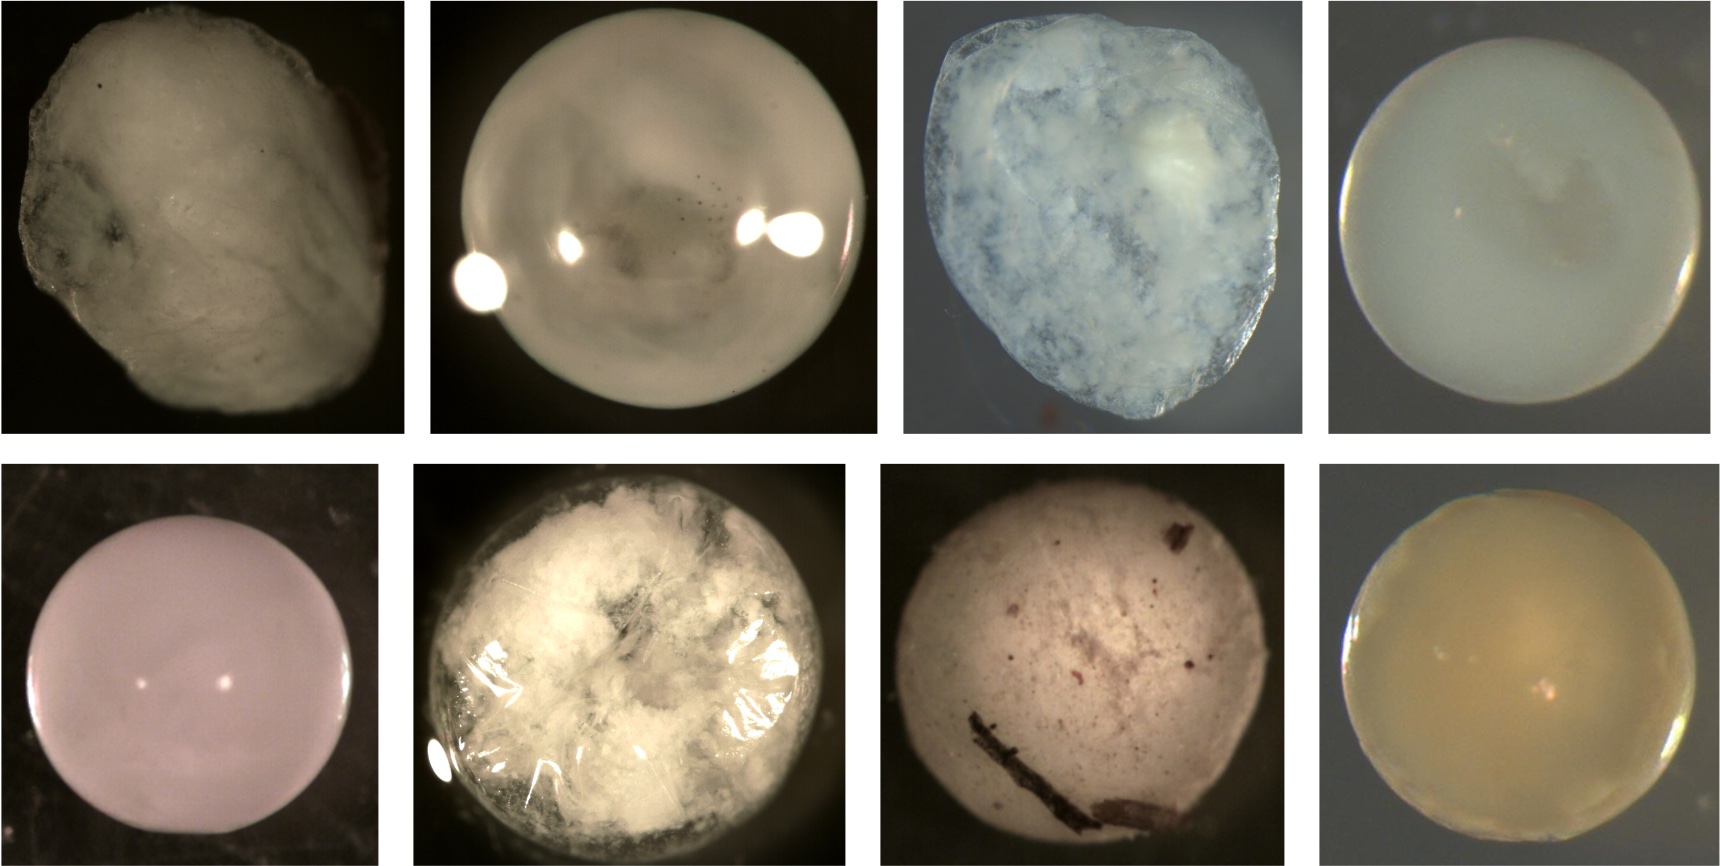
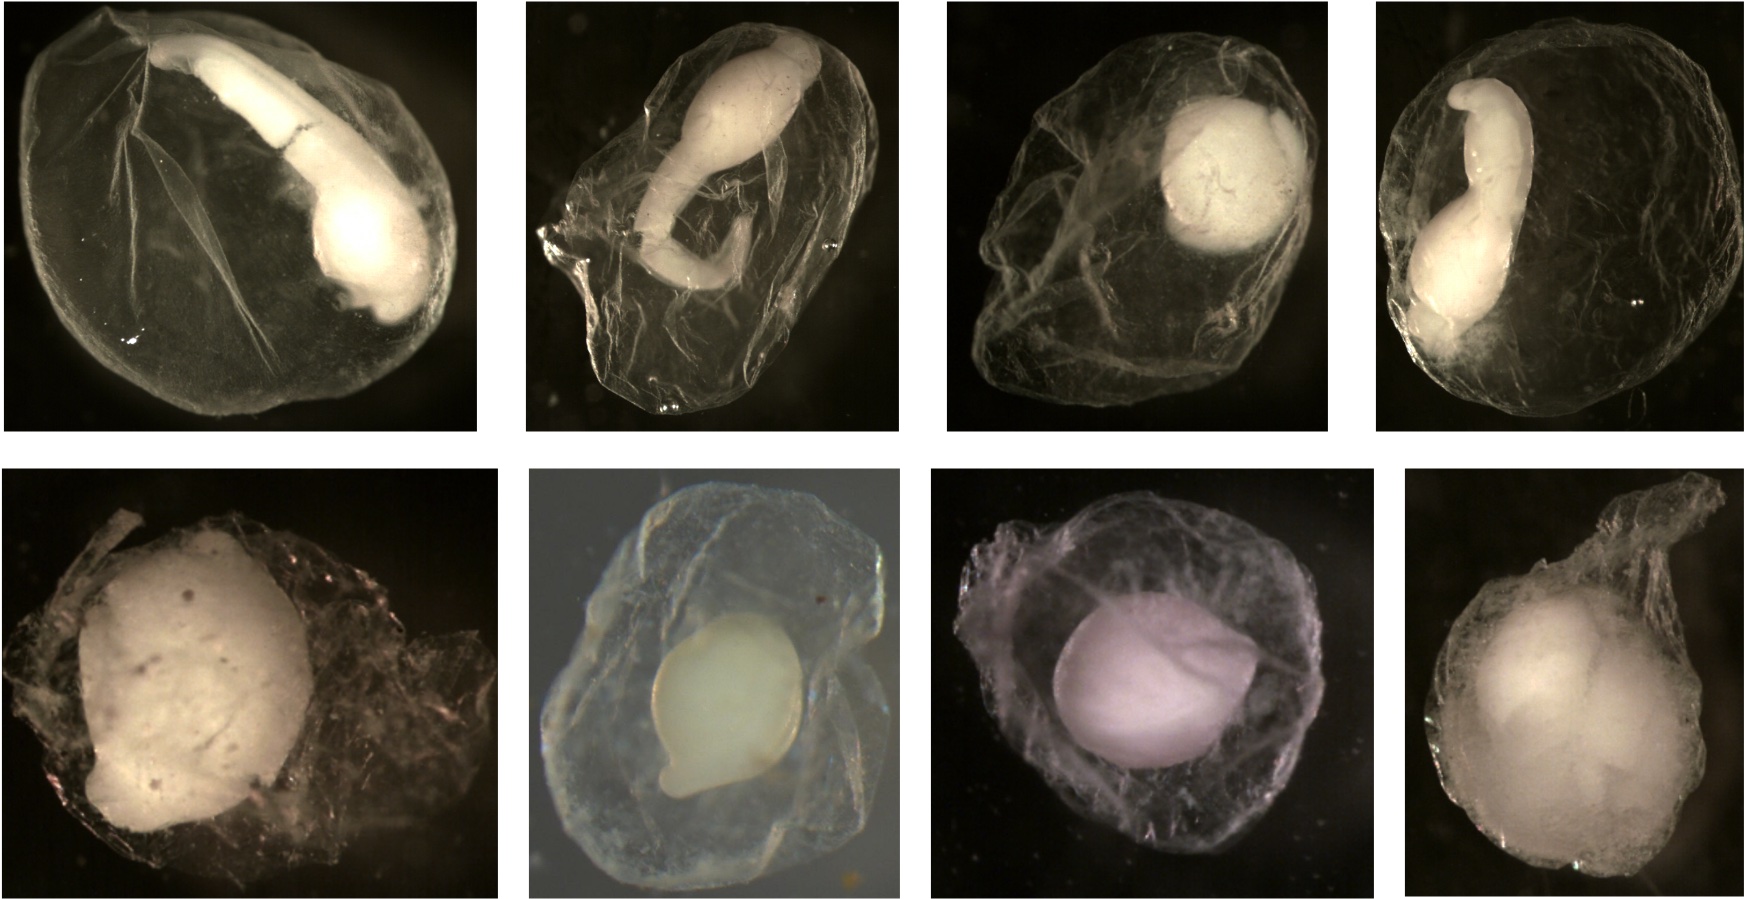
Examples of compact eggs: The embryo entity is clearly identifiable. Note that it is difficult to see the identifiable embryo of the egg in the top right corner. When the egg was viewed under a microscope, the embryo would roll around within the membrane. If you look closely at the right side of the embryo, you can see the space between the embryo and membrane. The embryo is compact but nearly as big as the membrane.
Examples of diffuse eggs: The embryo is not in a tightly compact entity within the membrane. The membrane appears to be filled with smoke or the embryo material is scrambled within the membrane.
Deflated
Definition: Specifies whether the egg is deflated or not
Spreadsheet Variable Name: Deflated
Format: N or Y
Required Upload or Computed After Upload: Required upload
Random Forest Predictor Variable: Yes
Additional Information:
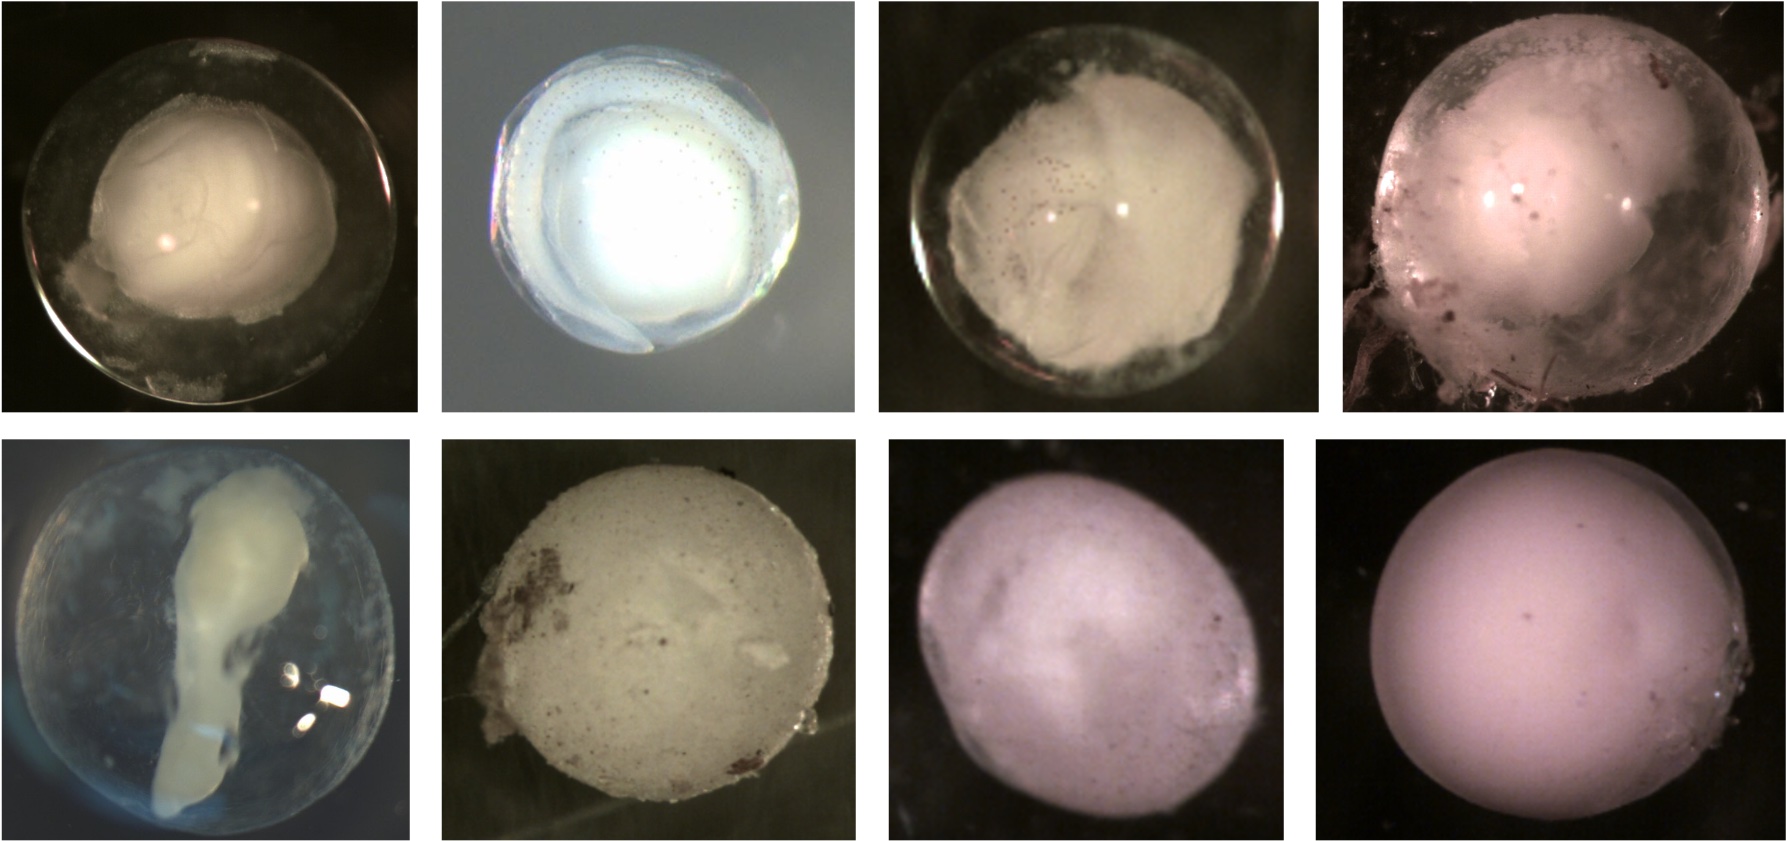
Examples of deflated eggs. All these membranes do not have a smooth surface or are spherical. Notice the dents and folds indicating the membrane is smaller now than when sampled. Some of this may be due to broken membranes from egg handling or desiccation from the ethanol. Most eggs in the training data were not ripped or broken. The membranes appeared intact but shriveled due to water being sucked out by the ethanol during preservation.
Examples of eggs that are not deflated. Notice all the membranes are spherical and smooth. You do not see folds or dents.
Egg Pigment
Definition: Specifies whether the egg has pigment or not
Spreadsheet Variable Name: Pigment
Format: N or Y
Required Upload or Computed After Upload: Required upload
Random Forest Predictor Variable: Yes
Additional Information:
Examples of eggs with pigment. Arrows point at chromatophores (cell containing pigment). Notice in the bottom middle image that the larger dark circles are eyes.
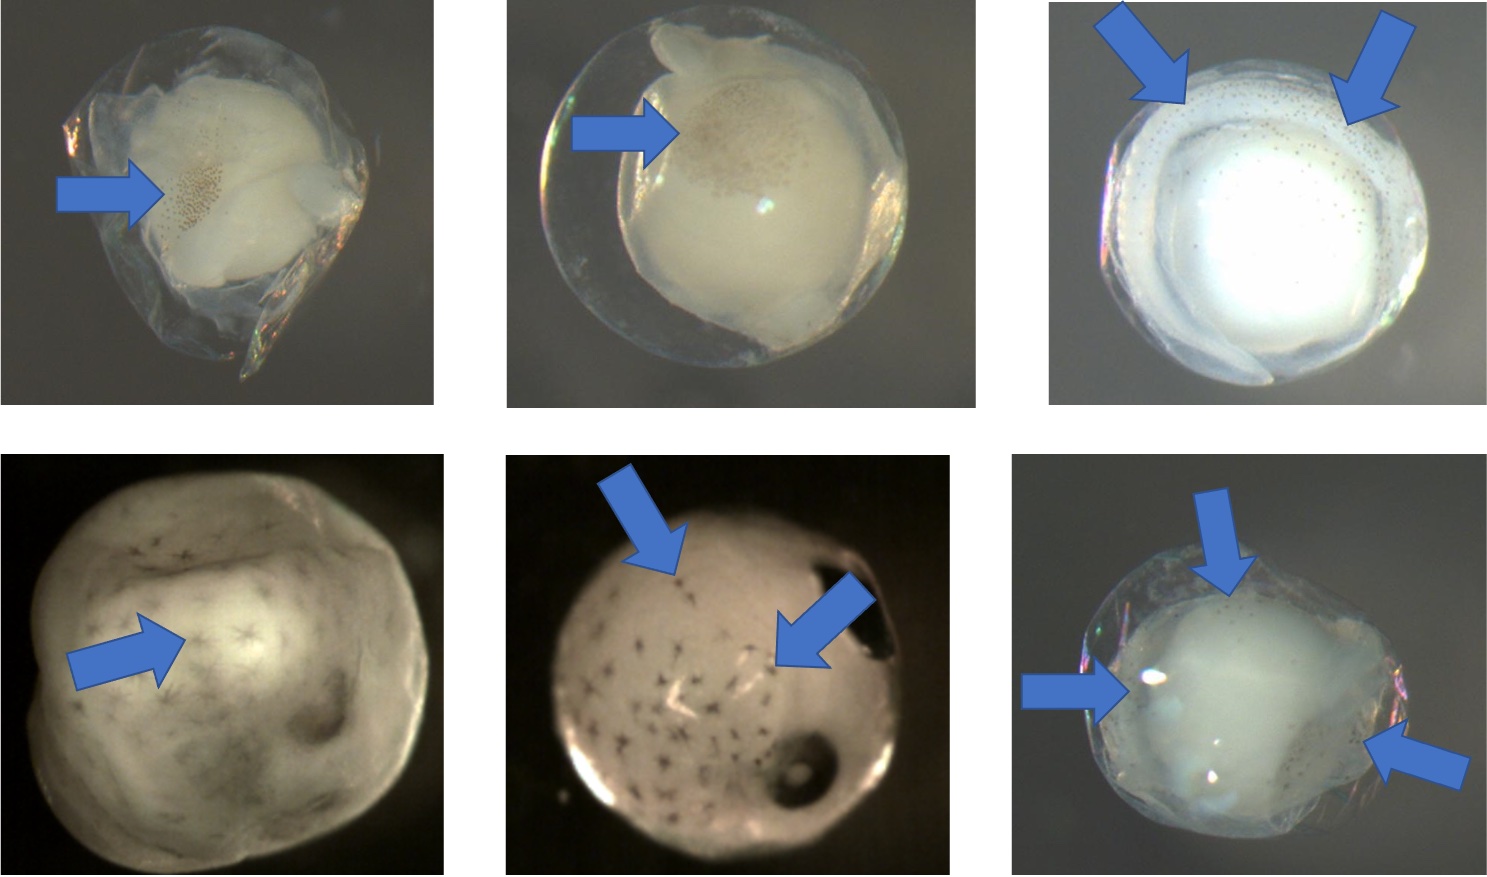
Examples of eggs without pigment. There are no chromatophores present.
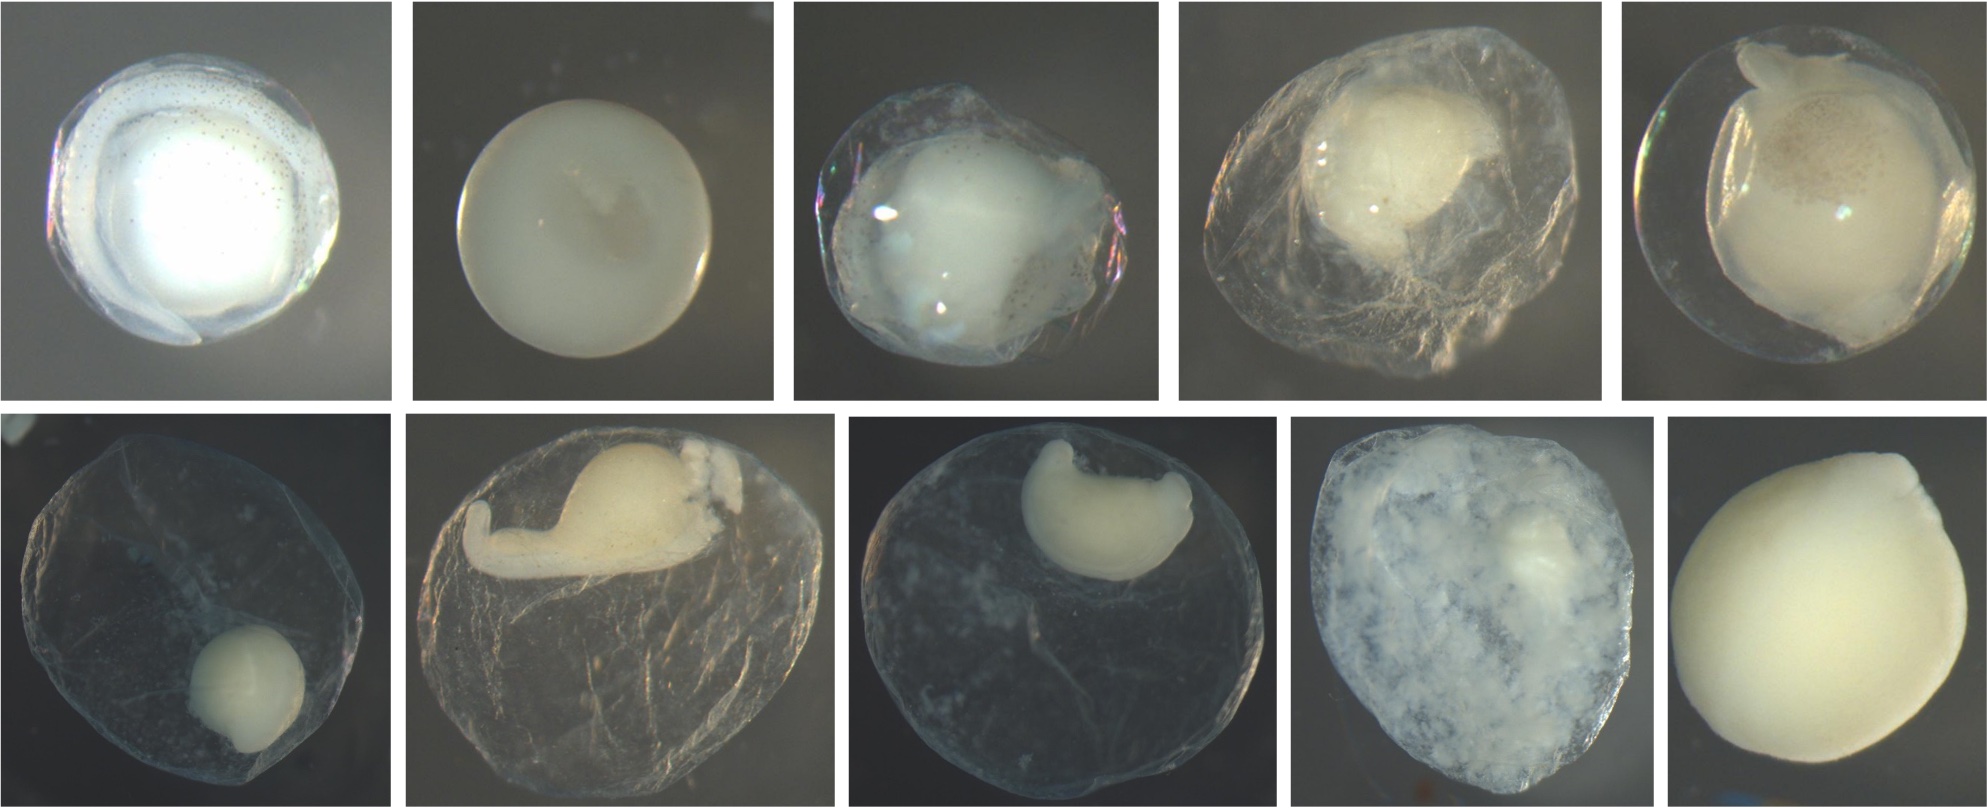
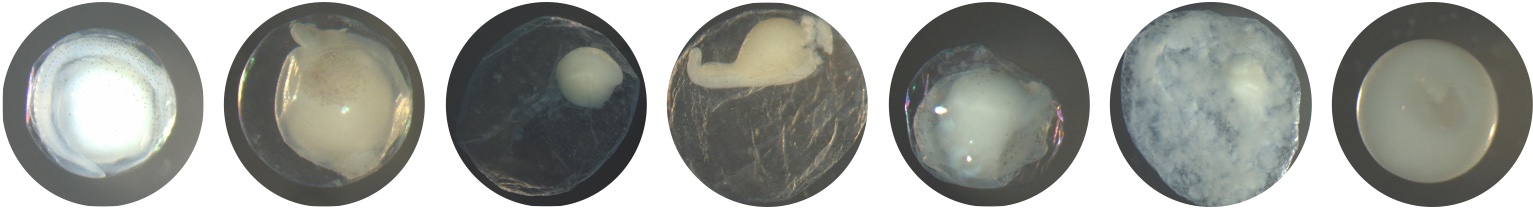
Egg Stage
Definition: Stage of the egg when collected - either 1 through 8, broken, or diffuse
Spreadsheet Variable Name: Egg_Stage
Format: One of 1, 2, 3, 4, 5, 6, 7, 8, BROKEN, D (where BROKEN indicates that the egg is broken and D indicates the egg is diffuse)
Required Upload or Computed After Upload: Required upload
Random Forest Predictor Variable: Yes
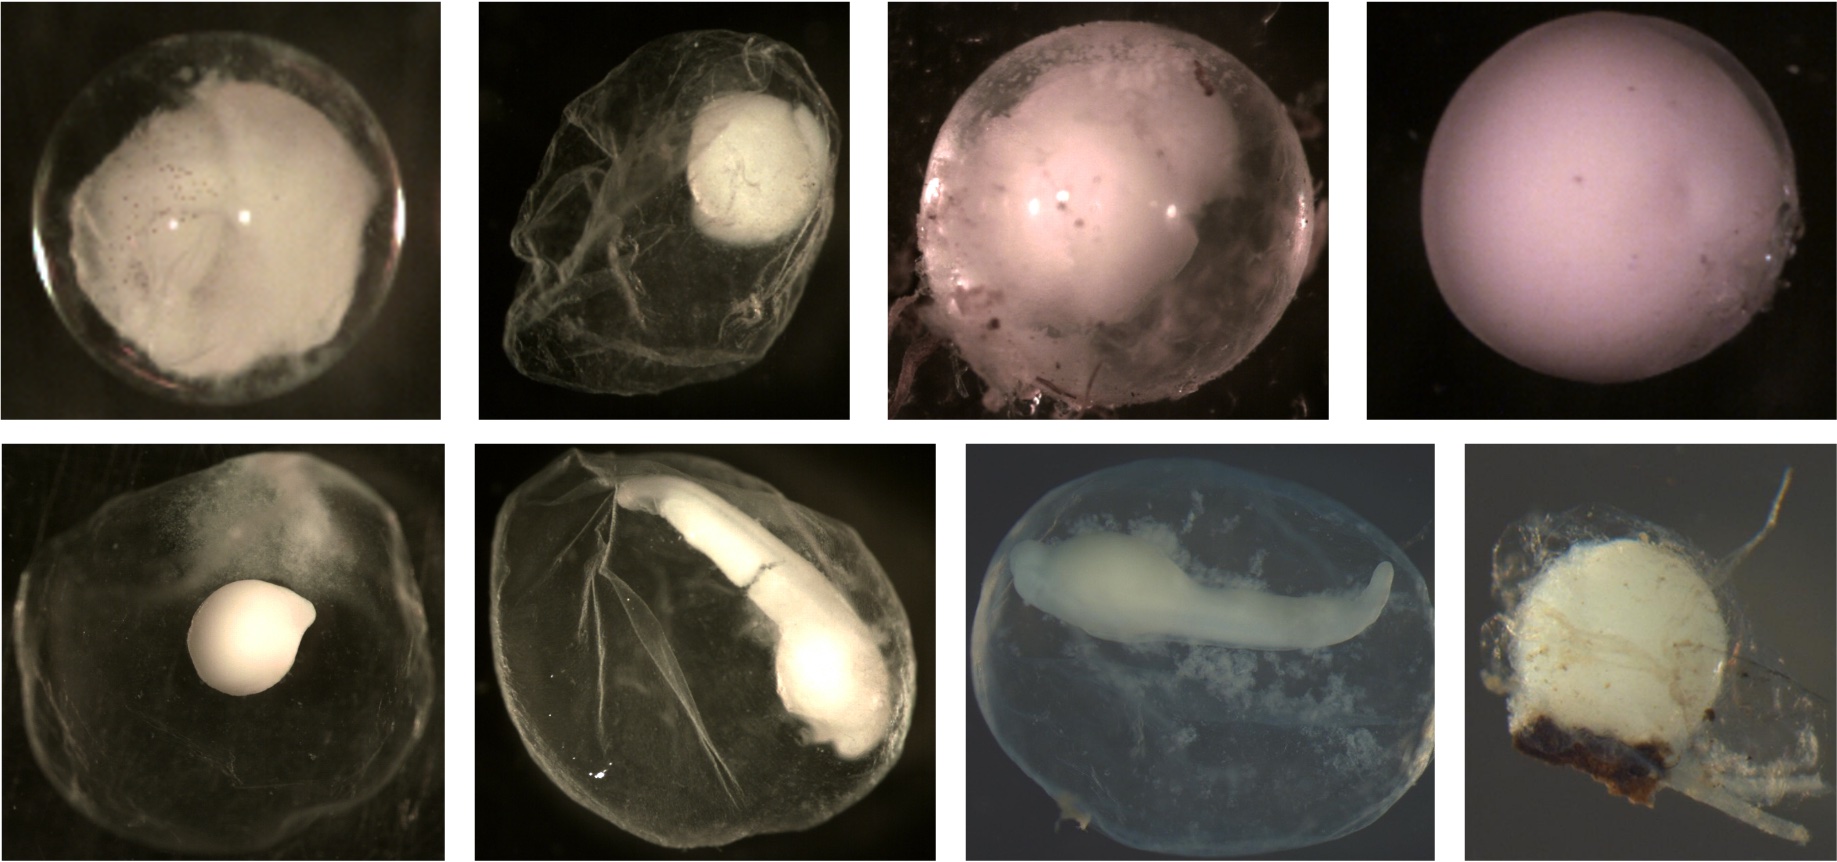
Additional Information: Below are examples of the stages. Most of these pictures of the stages are not great representations. Assessing the stage is accomplished best with the egg under a microscope, so that it can be moved around to inspect all sides and angles.
All diagrams of egg stages included below are from Kelso and Rutherford (1996). Permission to use the images was granted by the American Fisheries Society.
Egg Stage 1 (early cleavage): The blastomeres will look like prongs (typically 4) pointing in one direction. The arrows in the images point to the prongs. The top left is the best image showing the 4 prongs. They are not as pronounced, but the cleavage separating each blastomere is still apparent. The bottom left corner picture shows a side view of 2 prongs. It is difficult to get a picture looking directly into the prongs.
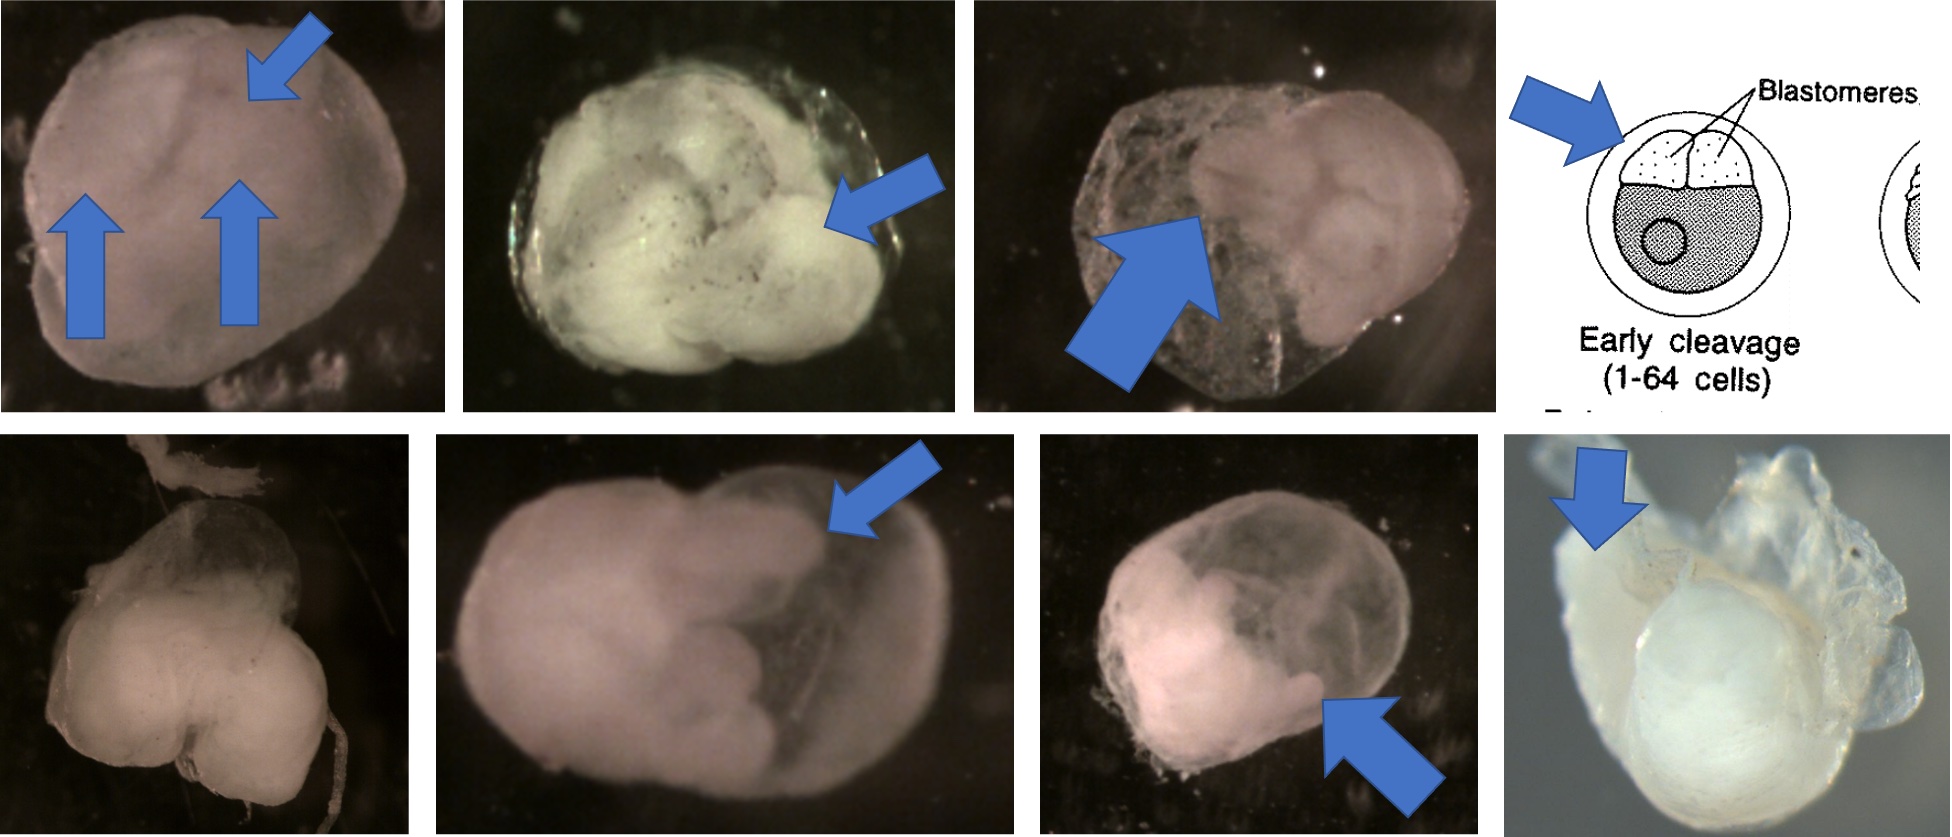
Egg Stage 2 (morula): The arrows point to blastomeres.
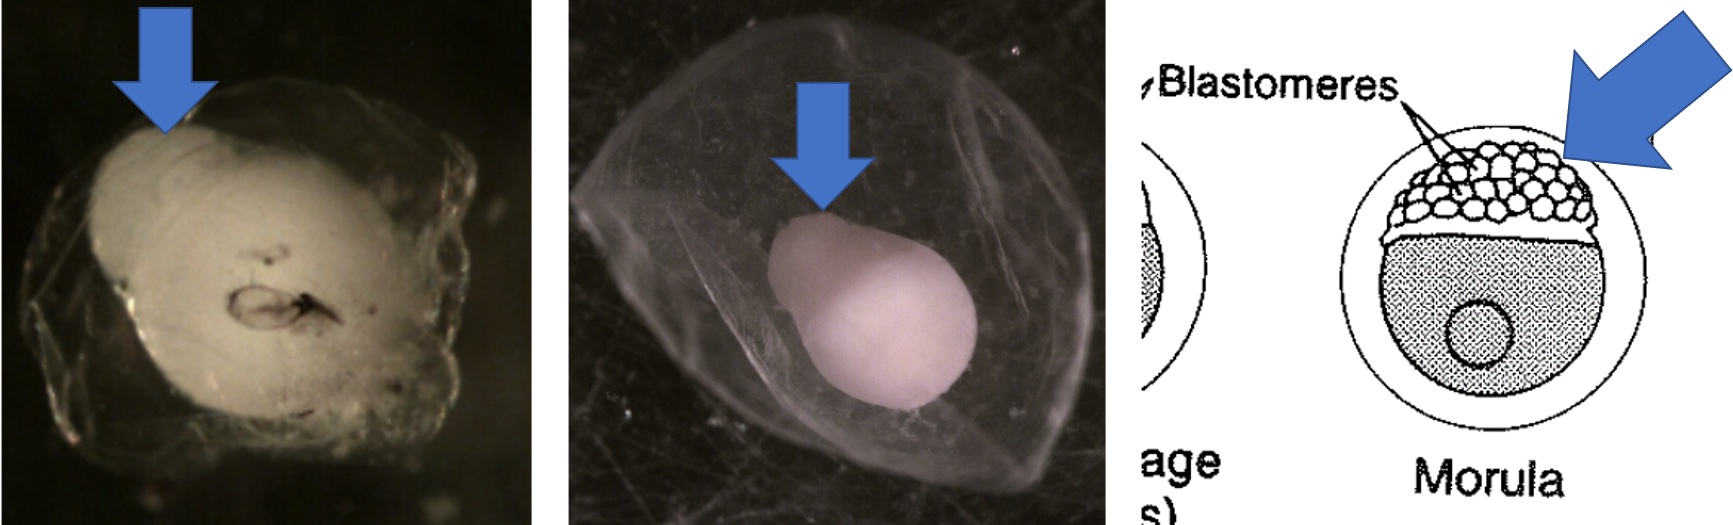
Egg Stage 3 (blastula):
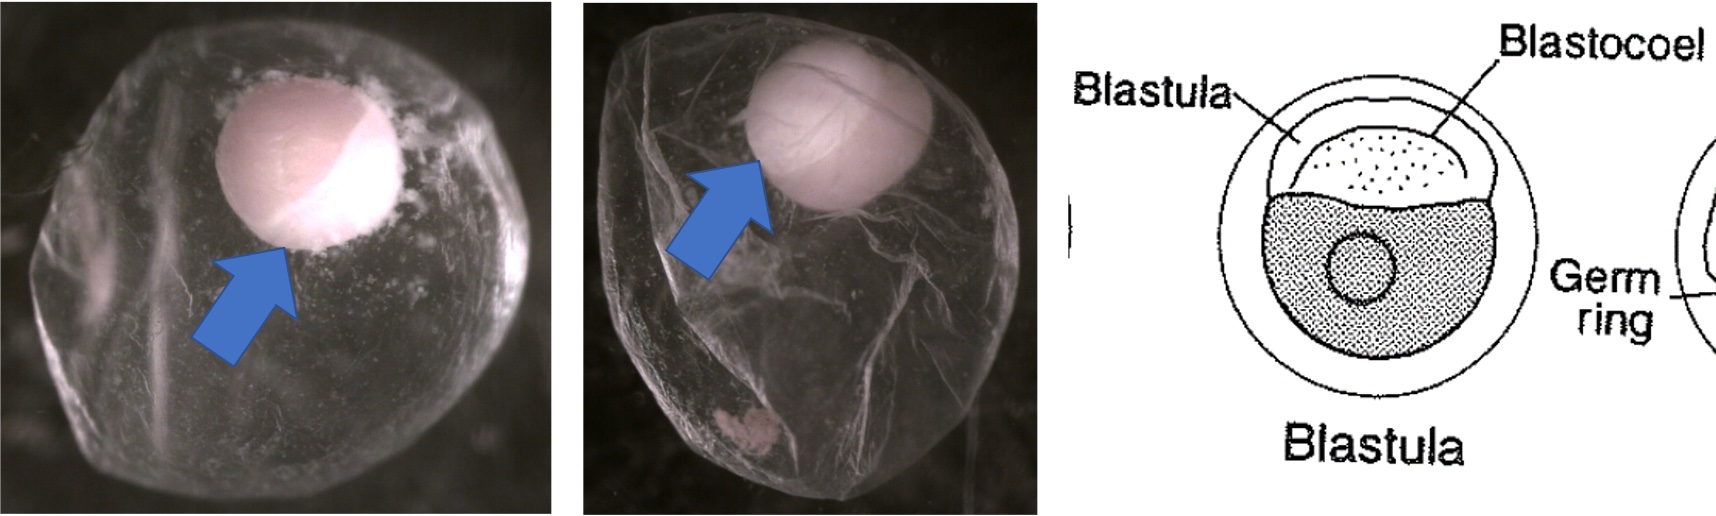
Egg Stage 4 (gastrula): The arrows point to germ rings.
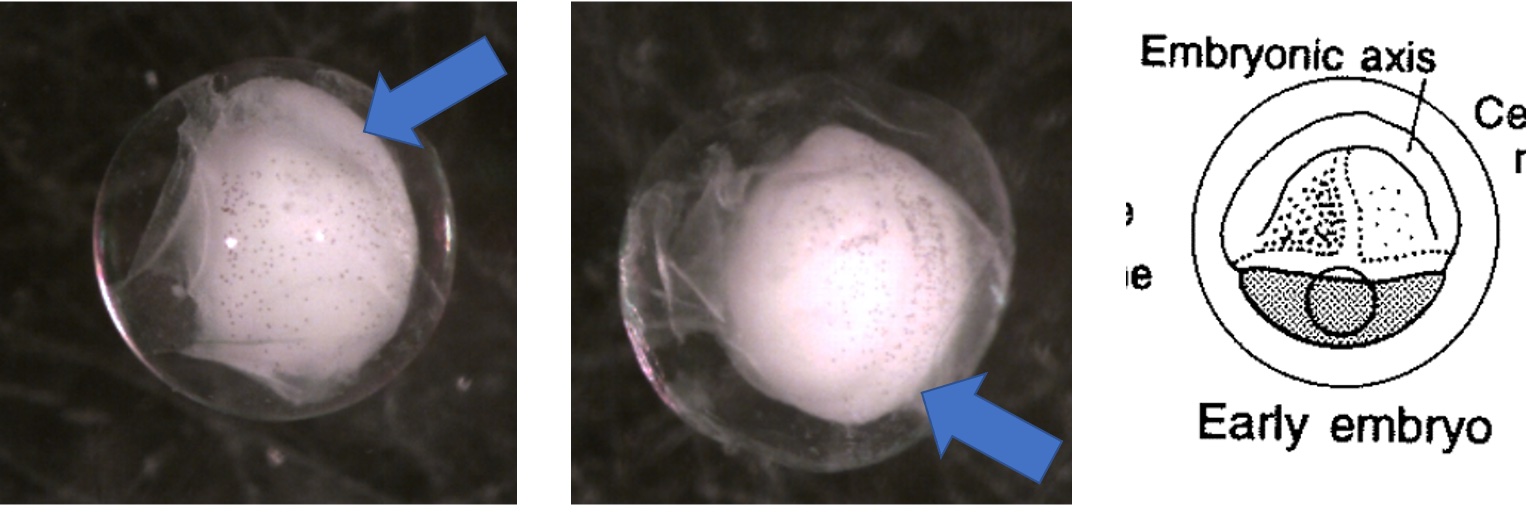
Egg Stage 5 (early embryo): The arrows point to embryonic axis (spine and back forming). This is best described as a ridge line that sticks out of the embryo.
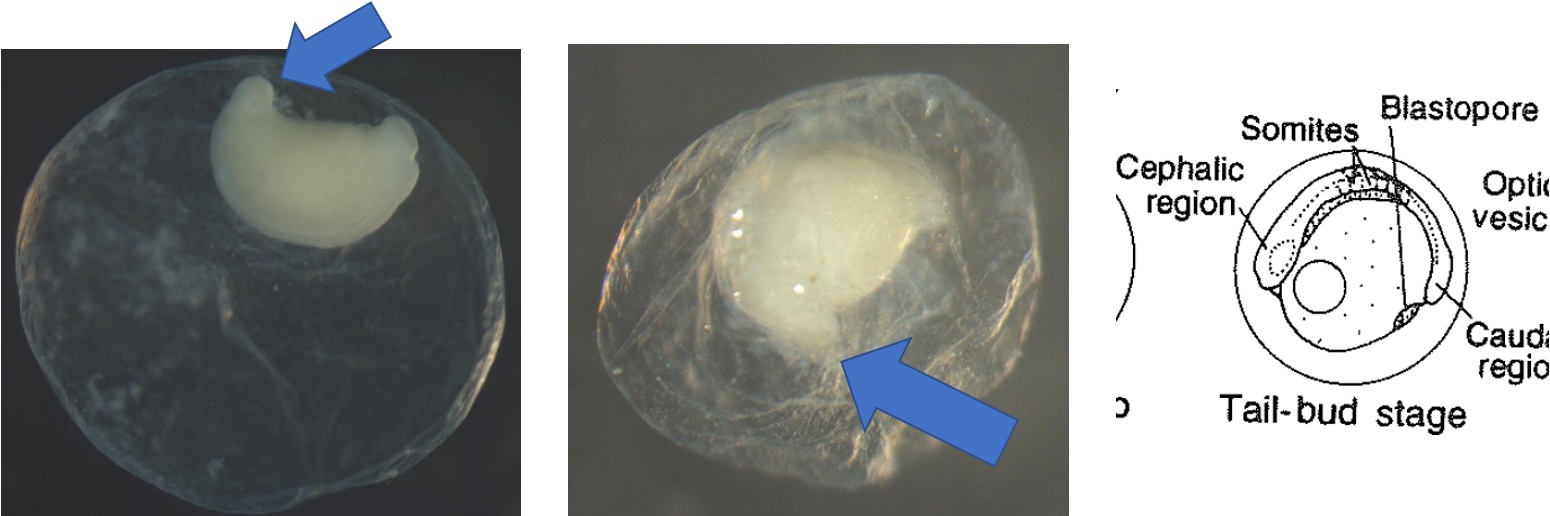
Egg Stage 6 (tail-bud stage): Out of the embryonic axis, the head and tail will form a rounded end. The tail will start to protrude away from the embryo.
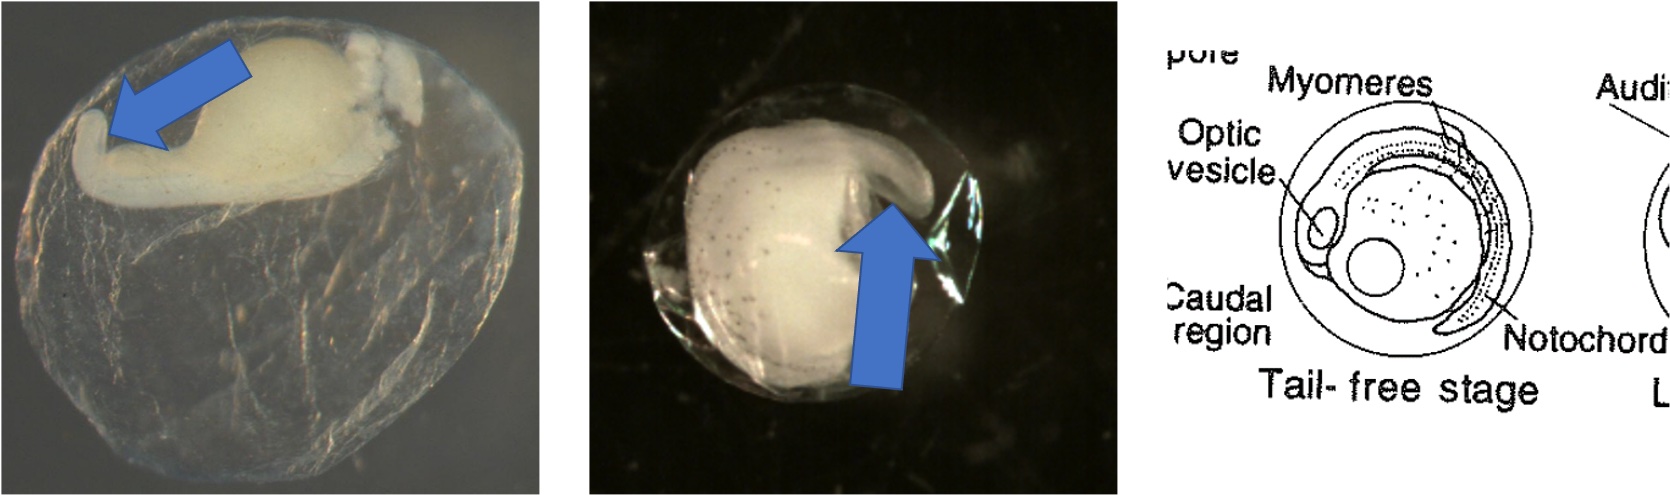
Egg Stage 7 (tail-free stage): The tail continues to protrude away from the embryo and is no longer touching the embryo. The arrows point to the tail not touching the embryo.
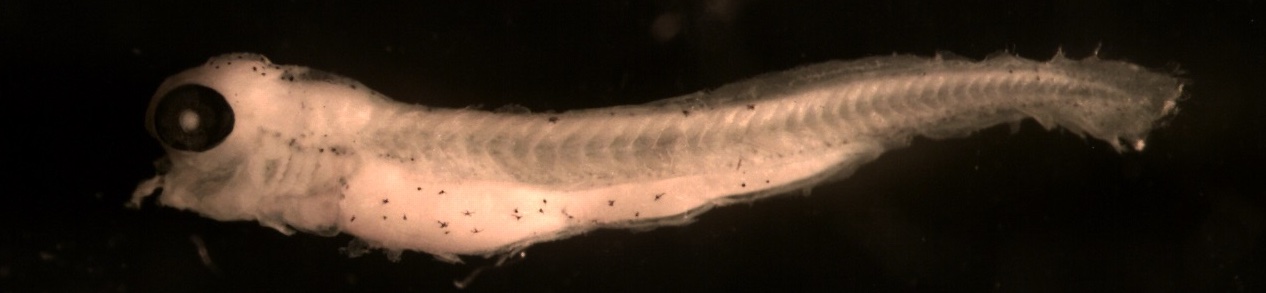
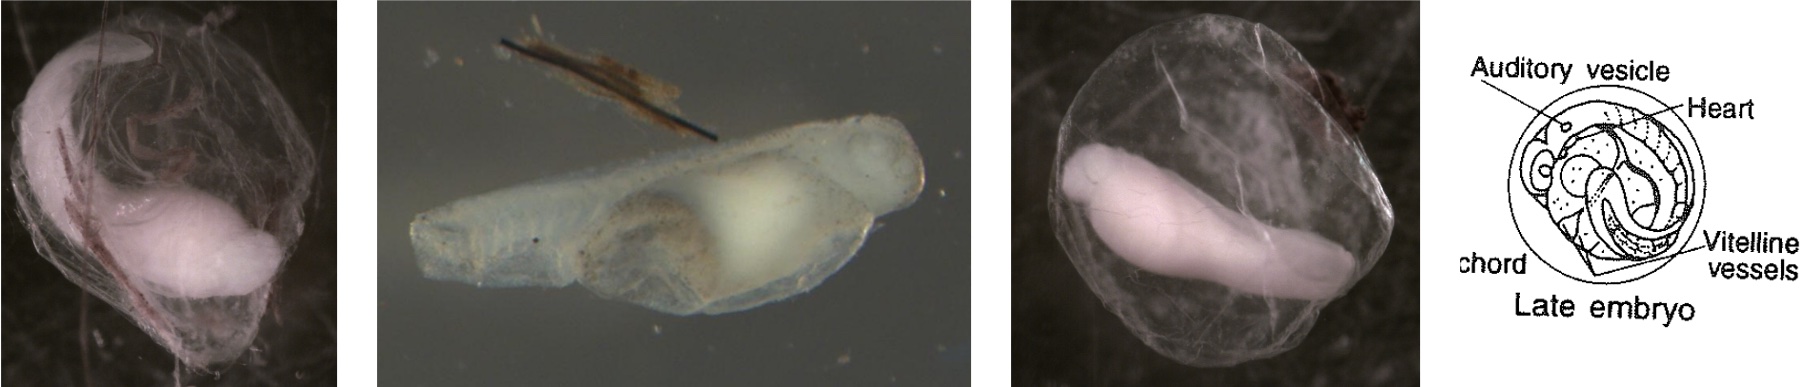
Egg Stage 8 (late embryo): The embryo is almost fully developed. Myomeres, eyes, auditory vesicle are all present. The egg is close to hatching.
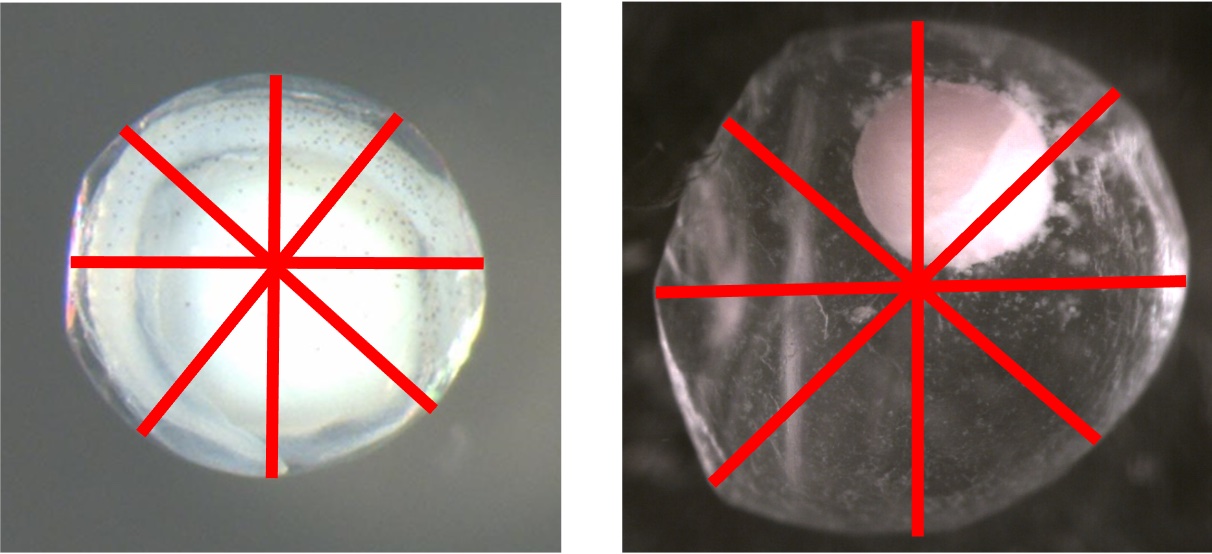
Embryo Diameter Average
Definition: Average of four diameter measurements (mm) taken from the embryo with starting points that are equally spaced around the circumference as defined by Kelso and Rutherford (1996)
Spreadsheet Variable Name: Embryo_Ave
Format: Positive continuous variable
Required Upload or Computed After Upload: Required upload
Random Forest Predictor Variable: Yes
Additional Information: The training data averages of embryo diameters range between 0.434 mm and 4.371 mm
The images below show examples of four equally spaced embryo diameter measurements.
Embryo Diameter Coefficient of Variation
Definition: Coefficient of variation (standard deviation / average) of four diameter measurements (mm) taken from the embryo with starting points that are equally spaced around the circumference as defined by Kelso and Rutherford (1996)
Spreadsheet Variable Name: Embryo_CV
Format: Positive continuous variable
Required Upload or Computed After Upload: Computed after upload
Random Forest Predictor Variable: Yes
Additional Information: The training data coefficients of variation of membrane diameters range between 0.003 and 0.724. See the figures included underneath Average of Embryo Diameters for examples of how the membrane diameters are measured.
Embryo Diameter Standard Deviation
Definition: Standard deviation of four diameter measurements (mm) taken from the embryo with starting points that are equally spaced around the circumference as defined by Kelso and Rutherford (1996)
Spreadsheet Variable Name: Embryo_SD
Format: Positive continuous variable
Required Upload or Computed After Upload: Required upload
Random Forest Predictor Variable: Yes
Additional Information: The training data standard deviations of embryo diameters range between 0.005 and 1.377. See the figures included underneath Average of Embryo Diameters for examples of how the membrane diameters are measured.
Embryo to Membrane Ratio
Definition: Ratio of average embryo diameter to average membrane diameter
Spreadsheet Variable Name: Embryo_to_Membrane_Ratio
Format: Positive continuous variable
Required Upload or Computed After Upload: Computed after upload
Random Forest Predictor Variable: Yes
Additional Information: The training data embryo to membrane ratios range between 0.257 and 1.137. See the figures included underneath Average of Membrane Diameters and Average of Embryo Diameters for examples of how the membrane and embryo diameters are measured.
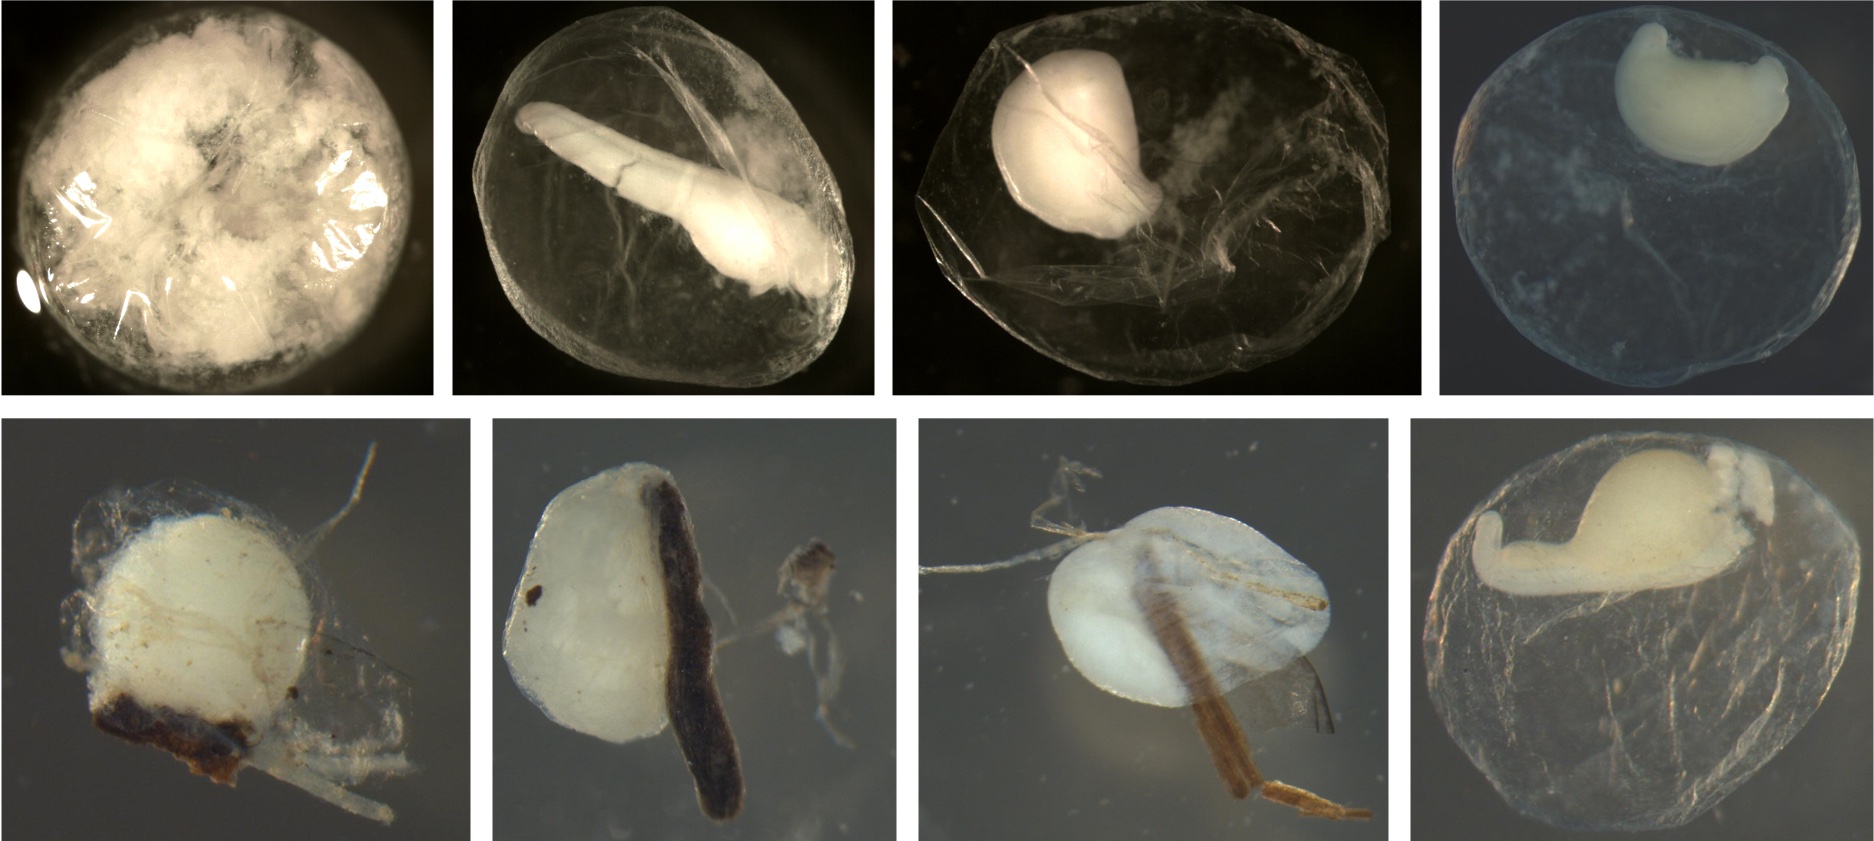
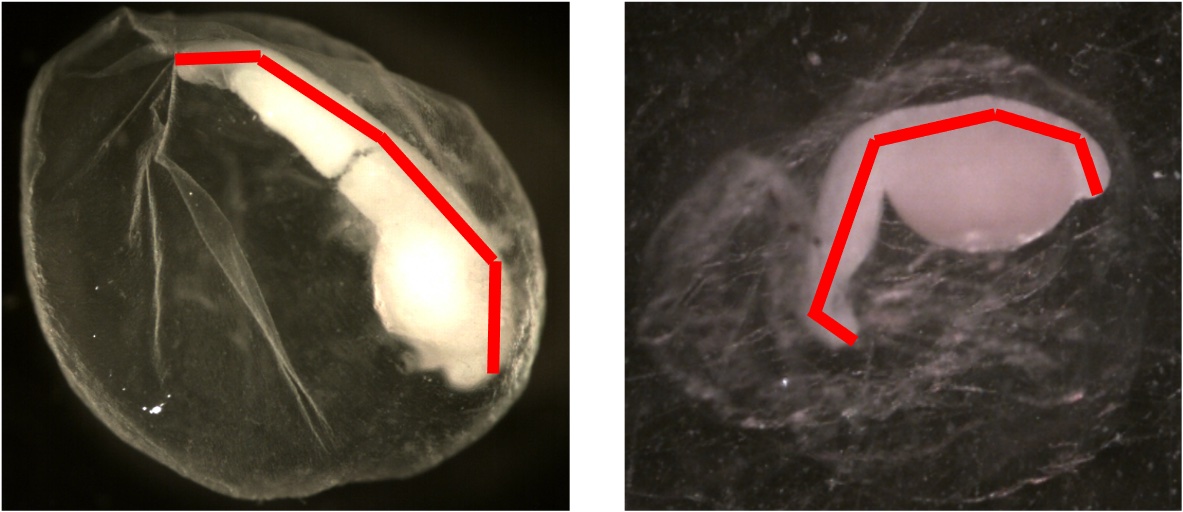
Larval Length
Definition: Total length measurement (mm) along the midline from all of the late stage embryos (eggs in stages 6-8)
Spreadsheet Variable Name: Larval_Length
Format: Positive continuous variable (set to 0 if egg is in stage 5 or less or egg is diffuse)
Required Upload or Computed After Upload: Required upload
Random Forest Predictor Variable: Yes
Additional Information: The training data larval lengths range between 0 mm and 5.089 mm.
Below is an example showing how larval length is measured.
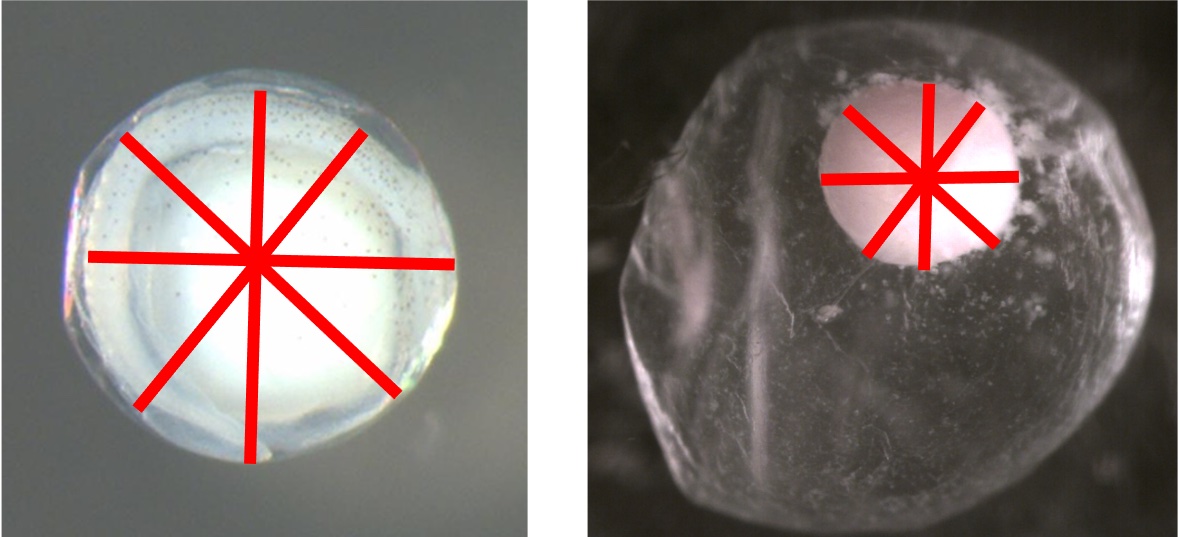
Membrane Diameter Average
Definition: Average of four diameter measurements (mm) taken from the membrane with starting points that are equally spaced around the circumference as defined by Kelso and Rutherford (1996)
Spreadsheet Variable Name: Membrane_Ave
Format: Positive continuous variable
Required Upload or Computed After Upload: Required upload
Random Forest Predictor Variable: Yes
Additional Information: The training data averages of membrane diameters range between 0.728 mm and 5.492 mm
The images below show examples of four equally spaced membrane diameter measurements.
Membrane Diameter Coefficient of Variation
Definition: Coefficient of variation (standard deviation / average) of four diameter measurements (mm) taken from the membrane with starting points that are equally spaced around the circumference as defined by Kelso and Rutherford (1996)
Spreadsheet Variable Name: Membrane_CV
Format: Positive continuous variable
Required Upload or Computed After Upload: Computed after upload
Random Forest Predictor Variable: Yes
Additional Information: The training data coefficients of variation of membrane diameters range between 0.001 and 0.52. See the figures included underneath Average of Membrane Diameters for examples of how the membrane diameters are measured.
Membrane Diameter Standard Deviation
Definition: Standard deviation of four diameter measurements (mm) taken from the membrane with starting points that are equally spaced around the circumference as defined by Kelso and Rutherford (1996)
Spreadsheet Variable Name: Membrane_SD
Format: Positive continuous variable
Required Upload or Computed After Upload: Required upload
Random Forest Predictor Variable: Yes
Additional Information: The training data standard deviations of membrane diameters range between 0.001 mm and 1.472 mm. See the figures included underneath Average of Membrane Diameters for examples of how the membrane diameters are measured.
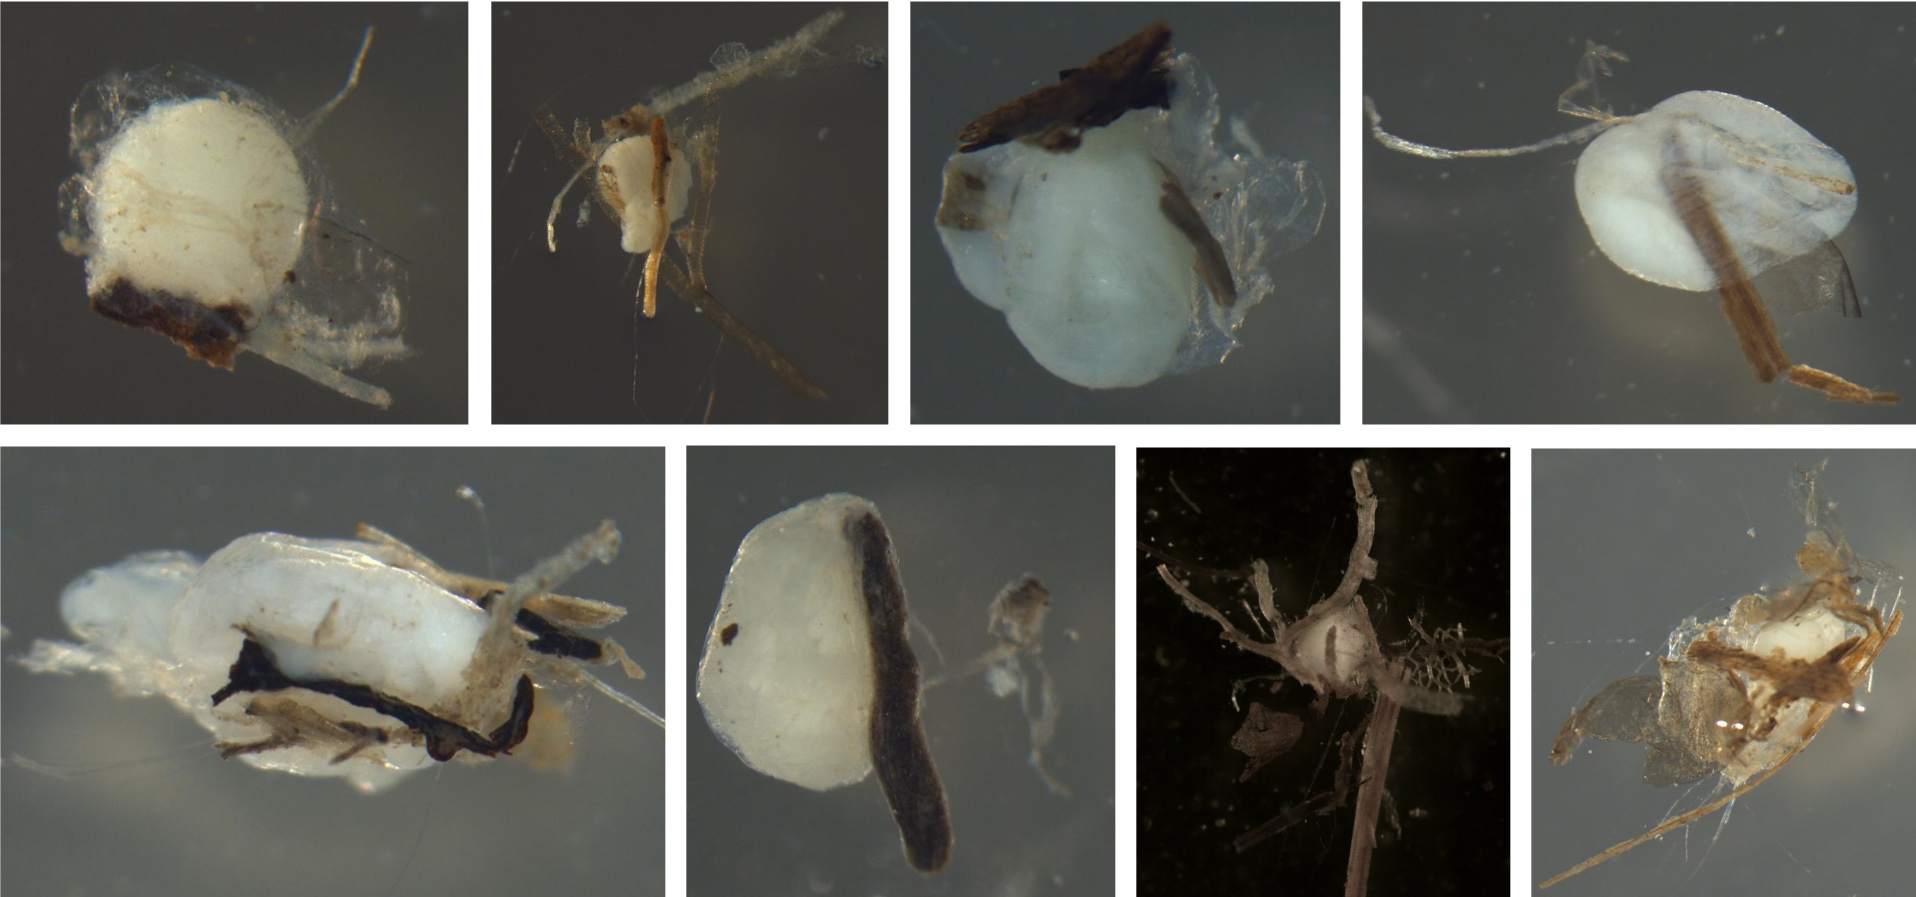
Sticky Debris
Definition: Specifies whether there is debris on the egg
Spreadsheet Variable Name: Sticky_Debris
Format: N or Y
Required Upload or Computed After Upload: Required upload
Random Forest Predictor Variable: Yes
Additional Information:
Examples of eggs with sticky debris. In all pictures, the debris is adhered to the eggs. Some fish have sticky eggs to keep them from drifting. Most of the debris is wood, but the top left shows sand can also stick to eggs.
Examples of eggs without sticky debris. There is no debris or sand on the membranes.